Introduction
The FX5 Neely Elliot Wave Indicator v1.2 for MT4 is designed for traders who want to apply advanced wave analysis without spending hours drawing and re-drawing wave structures. If you’ve ever struggled to understand where Wave 3 starts or whether a correction is a Zig-Zag or a Flat, this tool makes the whole thing smoother. The updated version 1.2 comes with better swing detection, more stable plotting, and smarter recalculation rules, so your waves won’t repaint like crazy.
Elliott Wave trading, tho powerful, is often confusing. Traders get stuck identifying impulse vs corrective waves, and by the time they finish marking the chart, the trade is already gone. FX5 Neely makes the process semi-automated — giving you the ability to trade confidently using a mix of structure, momentum, and Neely-style modifications.
This post covers everything: features, how it works, advantages, and how you can install and use it properly inside MT4.
What is FX5 Neely Elliot Wave Indicator v1.2 MT4?
The FX5 Neely version is based on Glenn Neely’s advanced interpretation of Elliott Waves. Instead of traditional wave counting, Neely’s technique adds:
- Stricter rules
- Clearer wave segmentation
- More reliable correction classification
The indicator reads market swing structure and auto-creates wave labels on your MT4 chart. It does not claim perfection — no wave tool can — but it definitely reduces confusion and gives you clean, consistent structures.
Key Features of FX5 Neely Elliot Wave Indicator v1.2 MT4
- Automatic Elliott Wave labeling
- Updated Neely-style rules for higher accuracy
- Detects impulse and corrective waves
- Identifies Waves 1 to 5 and A-B-C corrections
- Non-intrusive chart design for better clarity
- Suitable for all pairs and timeframes
- Smart swing detection avoids random noise
- Low CPU usage, even on multiple charts
- Helps pinpoint trend continuation zones
- Supports both beginners and advanced analysts
How the Indicator Helps You Trade
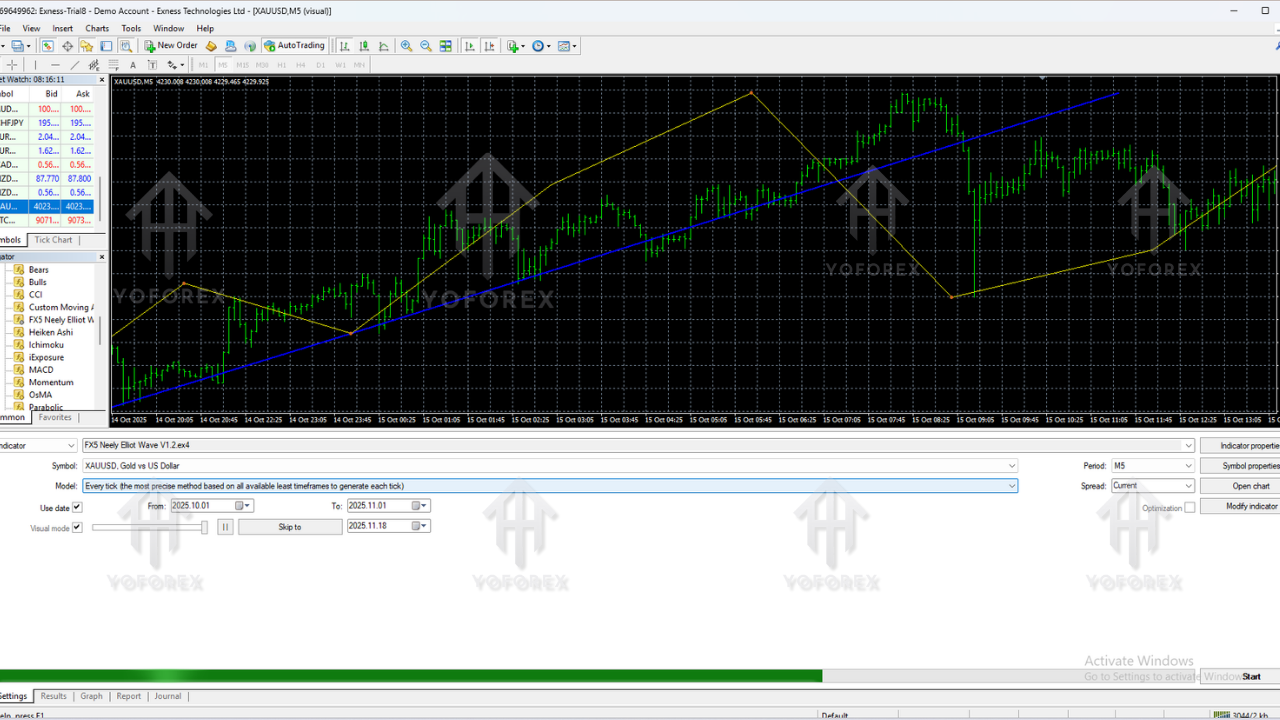
The indicator simplifies market structure by identifying swing points and classifying them into Elliott Wave phases. Instead of manually deciding whether a corrective structure is forming, the tool plots expected turning zones and labels the wave count.
This gives you a clearer understanding of:
Trend Direction
If you’re in Wave 3 or Wave 5, trends are often strong. If you’re in an A-B-C correction, the market may be slowing or preparing for a reversal.
Entry & Exit Zones
Wave 2 pullbacks, Wave 4 corrections, and Wave C reversals are common areas where traders look for high-probability entries and exits.
Stop-Loss Levels
Wave invalidation points help set cleaner stop-loss levels based on structure, not random guessing. This can improve your risk management quite a lot.
Continuation Confirmation
If the structure aligns with higher timeframe waves, the probability of trend continuation generally increases. You are not just trading one random swing; you’re trading within a bigger picture.
Why Traders Prefer the Neely Version
Glenn Neely brought more discipline to Elliott Wave theory. The FX5 Neely indicator follows these rules, which means:
- Less repainting of waves
- Better clarity around corrective patterns
- More dependable wave relationships
Most free Elliott Wave tools use very vague rules and end up redrawing constantly. This one is stricter, so the wave structures will generally remain more consistent as new candles print, which is a big deal if you hate seeing your entire wave count change every hour.
How to Install FX5 Neely Elliot Wave Indicator v1.2 MT4
Follow the steps below to install the indicator inside MetaTrader 4:
- Download the indicator file (either .ex4 or .mq4).
- Open your MT4 platform.
- Click on File → Open Data Folder.
- Navigate to MQL4 → Indicators.
- Paste the indicator file into the Indicators folder.
- Close and restart MT4.
- Open the Navigator panel and expand the Indicators section.
- Drag and drop FX5 Neely Elliot Wave Indicator v1.2 onto your chart.
- Adjust settings if needed and click OK.
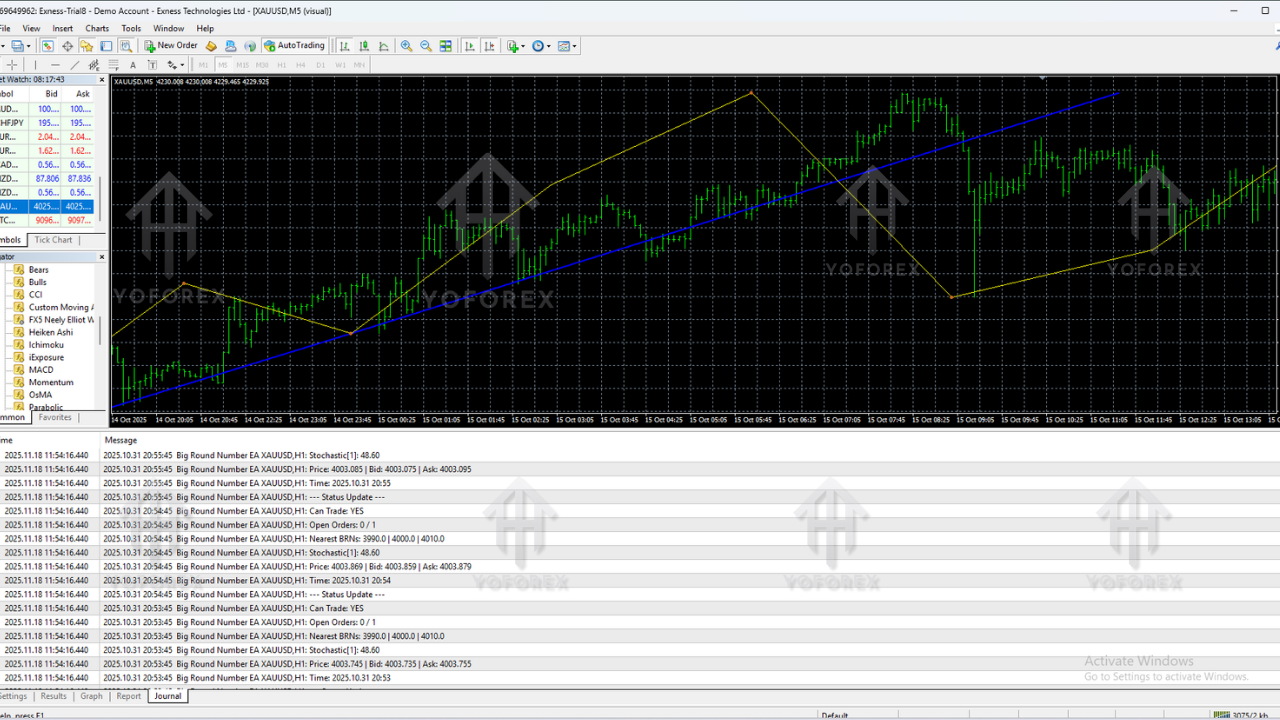
The indicator will instantly start detecting swings and displaying wave counts on your chart.
Recommended Settings
Most traders will be fine with the default settings, but you can tweak a few parameters if you want the waves to behave differently:
- Swing Sensitivity – increases or decreases wave frequency.
- Display Options – show or hide labels, lines, or auxiliary info.
- Color Settings – customize impulse wave colors and corrective wave colors for better visibility.
If markets are very choppy, try reducing sensitivity so you don’t get too many tiny waves. If the market is trending cleanly, you can increase sensitivity slightly to see more internal structure.
Best Timeframes for Use
Technically the indicator works on all MT4 timeframes, but in real trading, some periods are more practical than others:
- M15 – good for intraday swing entries.
- H1 – balanced between detail and clarity.
- H4 – great for swing trades and broader structure.
- D1 – for position traders and big-picture wave analysis.
Lower timeframes like M1 or M5 often produce too much noise and micro-waves, which can confuse the overall structure. You can still use them, but be ready for more clutter.
Supported Currency Pairs and Markets
The FX5 Neely Elliot Wave Indicator v1.2 MT4 works on basically any asset that your broker provides on MT4, including:
- Major Forex pairs (EURUSD, GBPUSD, USDJPY, USDCHF, etc.)
- Minor and exotic pairs
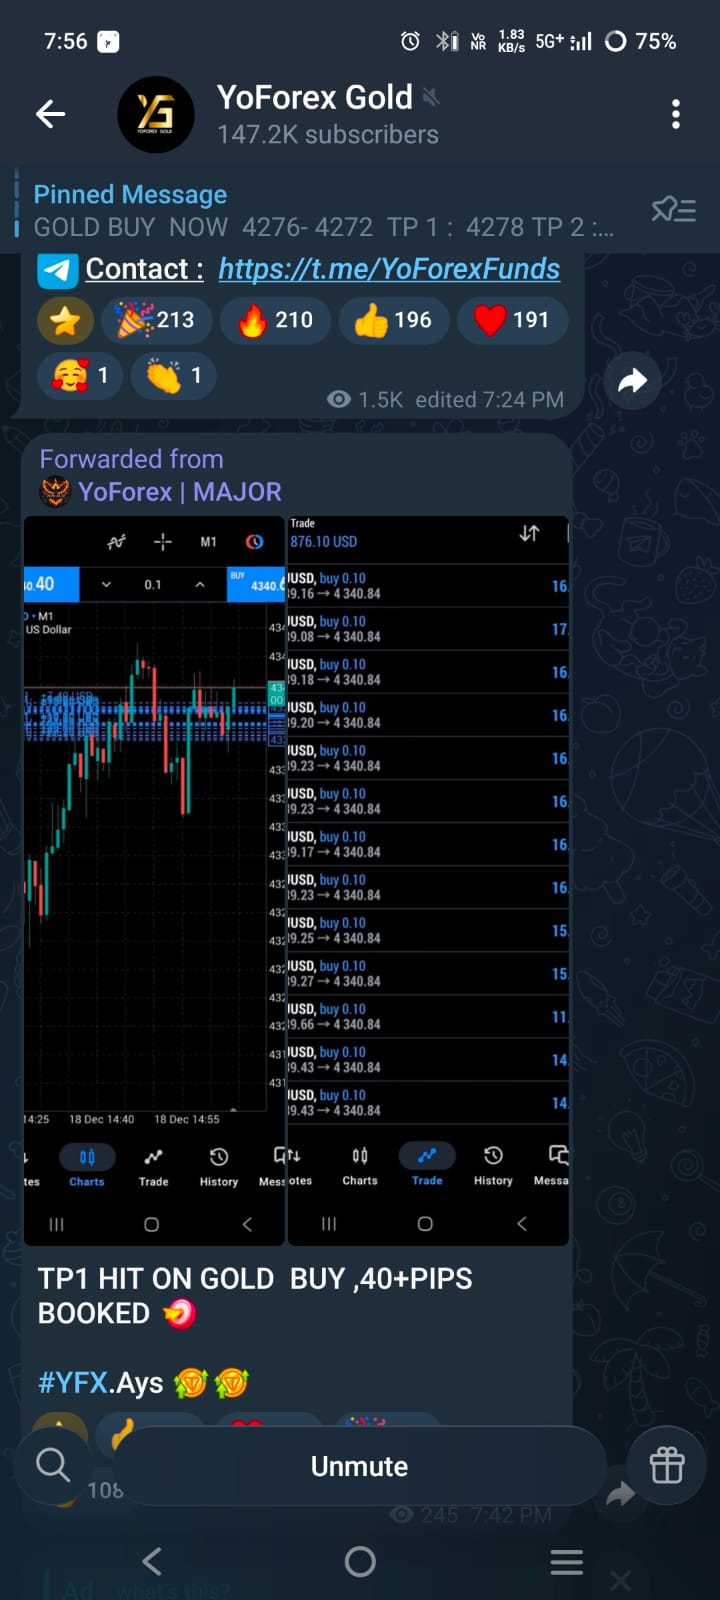
- Metals such as XAUUSD (Gold) and XAGUSD (Silver)
- Indices like NAS100, US30, GER40 (depending on broker)
- Crypto CFDs where available
Wave principles are universal, so as long as the market has enough liquidity and movement, the indicator can interpret its structure.
Trading Strategies Using FX5 Neely Elliot Wave Indicator
1. Wave 2 Pullback Strategy
This is a classic approach:
- Identify a fresh Wave 1 impulse with strong momentum.
- Wait for Wave 2 to retrace around 50%–61.8% of Wave 1.
- Look for confluence with support, Fibonacci, or price action.
- Enter in the direction of the Wave 3 expectation.
- Place stop-loss below the origin of Wave 1 or below a key structure.
2. Wave 4 Correction Continuation
Wave 4 is often a sideways or complex correction:
- Identify Wave 3 as a strong impulsive leg.
- Wait for a consolidating pattern during Wave 4.
- Enter when price breaks out in the direction of the previous trend, targeting Wave 5.
3. A-B-C Reversal Setup
The indicator also tags corrective A-B-C moves:
- Spot a completed impulse wave structure.
- Watch for a three-wave corrective pattern (A-B-C).
- Enter when Wave C completes and price shows reversal signs.
4. Multi-Timeframe Confirmation
One of the most powerful ways to use this tool:
- Use H4 or D1 to identify the main trend and wave structure.
- Drop to H1 or M15 for refined entries in line with the higher timeframe wave.
This way, you’re trading in harmony with the bigger cycle, not against it.
Advantages of Using FX5 Neely Elliot Wave Indicator
- Removes much of the complexity of manual Elliott Wave counting.
- Saves you a lot of time on technical chart marking.
- Improves your understanding of market structure.
- Keeps charts relatively clean and readable.
- Imposes a more disciplined, rule-based approach on wave analysis.
- Useful for both traders still learning waves and advanced analysts.
Limitations You Should Keep in Mind
- It does not provide perfect or guaranteed wave counts — no indicator can.
- Market spikes and news events can temporarily distort short-term wave structure.
- Over-reliance on wave analysis may cause some traders to ignore basic price action or risk management.
However, compared to many generic Elliott Wave indicators, this Neely-based version tends to stay more stable and consistent as new data comes in.
Conclusion
The FX5 Neely Elliot Wave Indicator v1.2 MT4 is a solid choice for traders who want to bring more structure and clarity into their technical analysis. It doesn’t replace your brain, but it does remove a lot of the repetitive, confusing parts of manual wave counting.
Whether you’re a beginner trying to really understand how waves unfold or an experienced trader who just wants to speed up your chart work, this indicator can become a reliable part of your toolkit. Use it with good risk management and sensible confirmation tools, and it can definitely add value to your decision-making process.


Comments
Leave a Comment