
The world of retail forex trading is often cluttered with complex mathematical oscillators and lagging indicators that promise high returns but frequently result in late entries and missed opportunities. Experienced traders understand that the most reliable data comes from the source itself: price movement. This is where the Pure Price Action Structures Indicator for MT5 comes into play. Developed to provide a clean and objective view of the market, this tool automates the detection of essential price action milestones without the interference of lagging formulas.
For those trading on MetaTrader 5, this indicator serves as a bridge between retail technical analysis and professional institutional methodologies. It focuses on the fundamental geometry of the market, allowing users to visualize shifts in momentum and trend continuations in real time. In this detailed guide, we will explore the internal mechanics of the indicator, its primary features, and how you can integrate it into a disciplined trading routine to enhance your market performance.
Understanding Market Structure in MetaTrader 5
Market structure is the backbone of price action trading. It refers to the arrangement of price peaks and troughs that define the current environment. A market is either trending upward, trending downward, or moving sideways. While this sounds simple, identifying these phases consistently is where many traders struggle. The Pure Price Action Structures Indicator for MT5 simplifies this by automatically labeling swing points based on their significance.
The indicator categorizes price action into three distinct levels of hierarchy: short term, intermediate term, and long term. Short-term swings represent the minor fluctuations or noise often seen on lower timeframes. Intermediate-term swings show the primary intraday moves, while long-term swings define the overall macro trend. By separating these layers, the indicator allows traders to maintain a clear perspective on the larger market narrative while navigating the smaller price movements.
Key Features of the Pure Price Action Structures Indicator
What sets this tool apart from standard zig-zag indicators or trendline tools is its focus on specific structural events that signal institutional activity. Below are the core features that the indicator tracks on your MT5 charts.
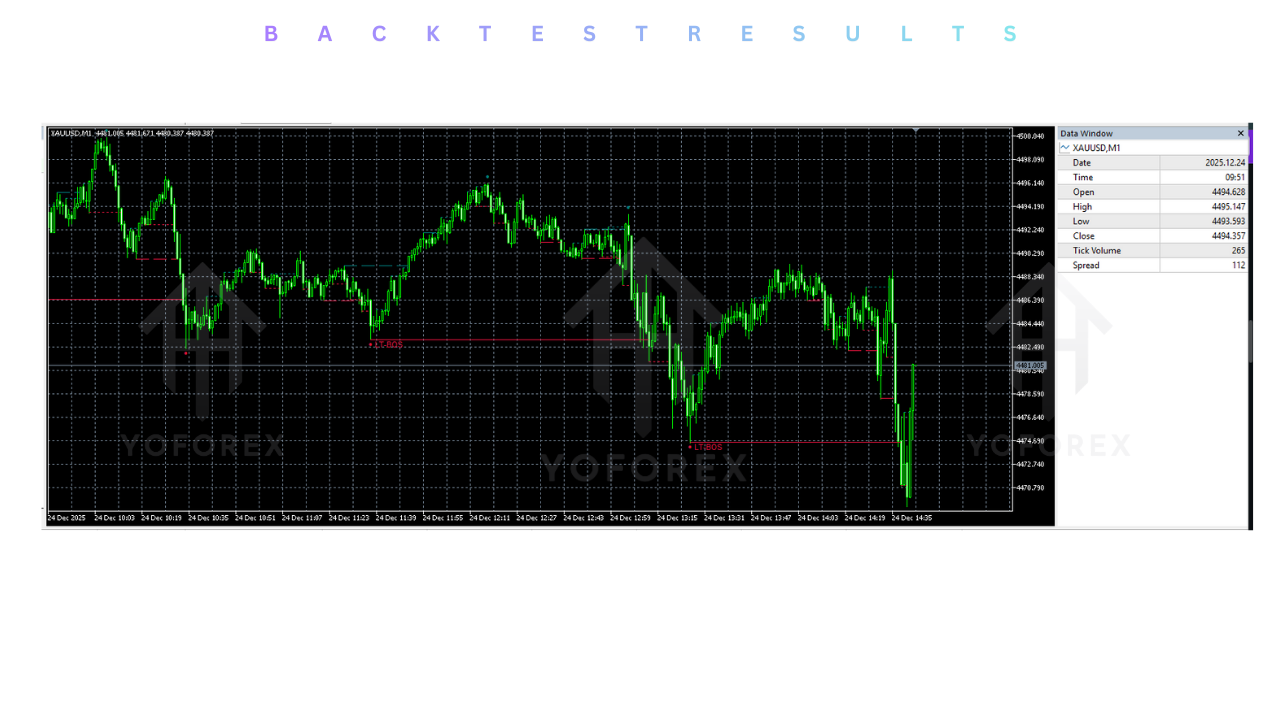
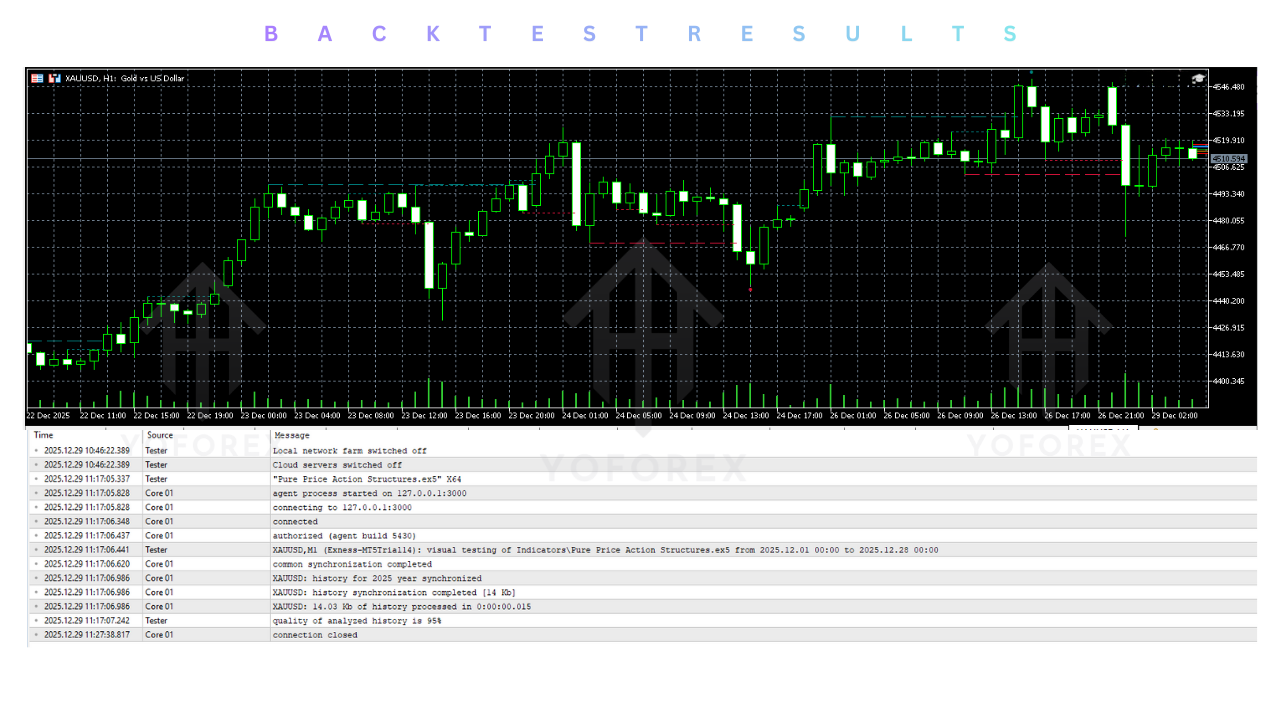
Break of Structure (BOS)
A Break of Structure is a confirmation signal. It occurs when the price continues in its established direction by breaking through a previous high or low. In a bullish market, a BOS happens when price closes above a recent swing high. In a bearish market, it occurs when price closes below a recent swing low. The Pure Price Action Structures tool identifies these moments instantly, signaling to the trader that the current trend has successfully maintained its momentum and is likely to continue further.
Change of Character (CHoCH)
The Change of Character, or CHoCH, is a warning signal. It is the first indication that the current trend may be coming to an end. This event occurs when the price breaks a swing point in the opposite direction of the trend. For instance, if price has been making higher highs and higher lows but suddenly drops below the most recent higher low, the character of the market has changed from bullish to bearish. The indicator highlights these shifts, helping traders avoid buying at the top of a dying trend or selling at the bottom of a reversal.
Order Blocks and Breaker Blocks
Institutional traders do not enter the market with a single click. Instead, they place large blocks of orders that leave footprints in the price action. The indicator identifies these "Order Blocks," which are specific zones where significant buying or selling occurred before a major move. When price returns to these zones, they often act as powerful support or resistance. Similarly, "Breaker Blocks" are identified when an old order block is broken, causing it to flip its function, much like how old support becomes new resistance.
Liquidity Voids and Fair Value Gaps
Markets often move so quickly that they leave behind "voids" or gaps where price was not efficiently delivered. These areas are known as Fair Value Gaps (FVG) or Liquidity Voids. The Pure Price Action Structures Indicator for MT5 maps these zones out, as price has a historical tendency to return to these gaps to "rebalance" the market before continuing its journey.
Strategic Implementation and Execution
Having the data is one thing; knowing how to trade it is another. A common approach used with this indicator is a top-down analysis strategy. This method ensures that your trades are aligned with the dominant market forces.
Daily Bias Identification: Start by looking at a higher timeframe, such as the 4-hour or Daily chart. Identify the most recent long-term BOS. If the last break was bullish, you should prioritize buy setups.
Zone Selection: Look for an Order Block or a Liquidity Void highlighted by the indicator on the higher timeframe. This is your "Point of Interest."
Wait for Retracement: Allow the price to pull back into your selected zone. Trading against the trend is risky, so you must wait for the price to come to you.
Lower Timeframe Confirmation: Once the price enters your zone, move to a lower timeframe like the 15-minute or 5-minute chart. Wait for the indicator to print a CHoCH in your desired direction. This confirms that the buyers (or sellers) are reclaiming control at a key level.
Entry and Risk Management: Place your entry at the newly formed lower timeframe order block. Your stop loss should be placed logically behind the swing point that caused the reversal, and your target should be the next major liquidity level identified by the indicator.
Advantages of Using Automated Price Action Tools
The primary benefit of using an automated structure indicator is the removal of subjectivity. Two different traders looking at a blank chart might draw two different sets of trendlines. However, the Pure Price Action Structures Indicator uses fixed mathematical logic to identify peaks and troughs, ensuring that your analysis remains consistent day after day. This consistency is vital for developing a professional trading edge.
Furthermore, because the indicator works directly with the closing prices of candles, it provides a lag-free experience. Unlike a Moving Average that needs several periods to catch up to a price spike, a structural break is recognized the moment the candle closes. This allows for faster reaction times in fast-moving markets like XAUUSD or major currency pairs.
Common Pitfalls to Avoid
While the indicator is a powerful ally, it is not a magic solution. Traders must still apply sound judgment and risk management. One common mistake is trading every single BOS or CHoCH that appears. In ranging or consolidating markets, price will often break minor structures in both directions without establishing a clear trend. It is essential to focus on structures that align with higher timeframe bias.
Additionally, pay attention to "Liquidity Sweeps." Sometimes price will break a high or low just to trigger stop losses before reversing. If the indicator shows a break but the candle immediately closes back inside the range with a long wick, it may be a fakeout rather than a genuine break of structure.
Conclusion
The Pure Price Action Structures Indicator for MT5 is an essential tool for any trader looking to master the art of price action and Smart Money Concepts. By automating the tedious task of marking highs, lows, and structural shifts, it frees up your mental energy to focus on what matters most: execution and risk management. Whether you are a beginner looking for clarity or an experienced trader seeking an objective second opinion, this indicator provides the structural framework necessary to navigate the complex forex markets with confidence.


Comments
Leave a Comment