
Crowded charts make decision-making hard. The i-Regr Indicator for MT4 keeps things simple by plotting a linear regression line with dynamic deviation bands (a regression channel), so you can visualize the dominant trend, volatility, and high-probability reaction zones at a glance. If you’re tired of guessing whether a move is just noise or the start of a trend, regression is a clean, math-driven way to anchor your bias.
This guide breaks down what i-Regr does, how to set it up, and several practical strategies for scalping, day trading, and swing trading. You’ll also get suggested presets, risk tips, and FAQs so you can put the indicator to work immediately.
What Is i-Regr Indicator MT4?
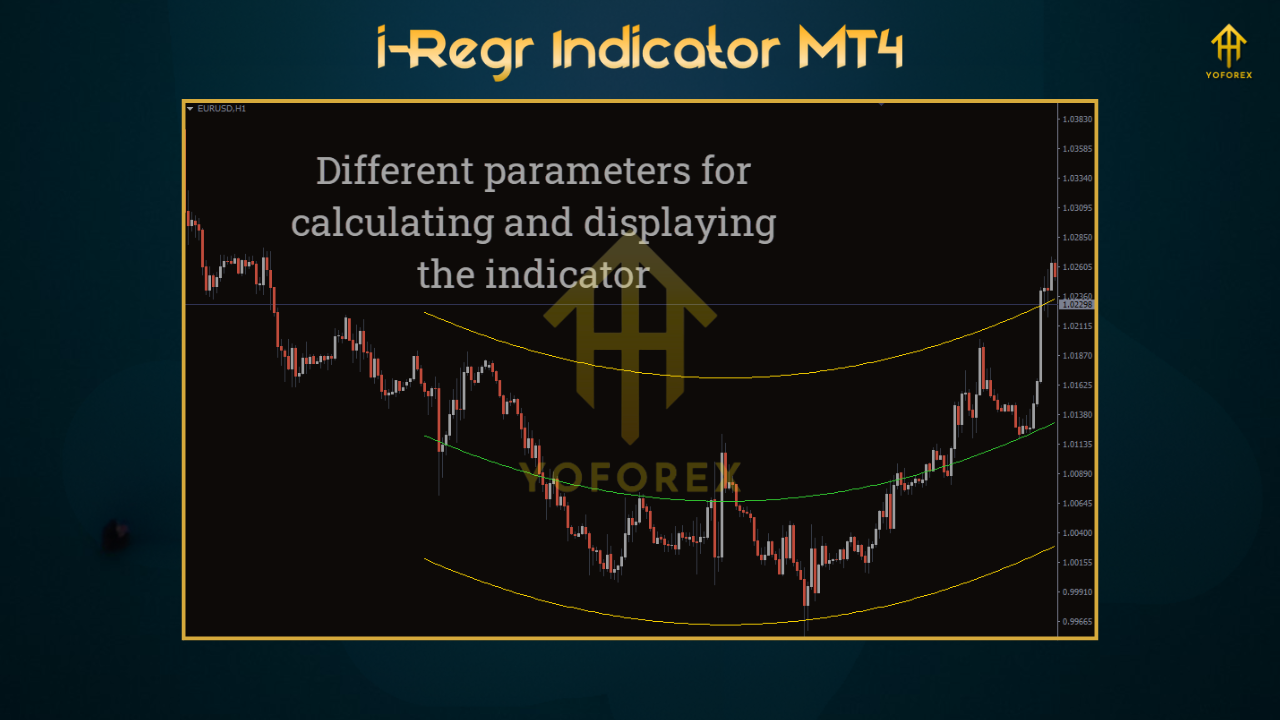
i-Regr is a lightweight linear regression channel indicator for MetaTrader 4. It calculates the best-fit line (least squares) for the most recent N bars, then builds upper and lower bands based on price deviation from that line. The result is a dynamic channel that adapts with the market—revealing trend direction (via the line’s slope), momentum (steepness), and potential support/resistance (via the bands).
- Platform: MetaTrader 4 (MT4)
- Markets: Major/minor FX pairs, XAUUSD (Gold), indices/crypto (if your broker supports them on MT4)
- Timeframes: M5 to H4 (popular: M5/M15 for scalps, M15/H1 for day trading, H1/H4 for swings)
- Skill Level: Beginner-friendly, pro-approved
Key Features (Why Traders Choose i-Regr)
- True Linear Regression Core: Best-fit line captures underlying trend, not just moving average drift.
- Deviation Bands (Channels): Visualize volatility; use bands to frame entries/exits and set logical stops.
- Slope Bias Filter: Positive/negative slope highlights trend direction for instant context.
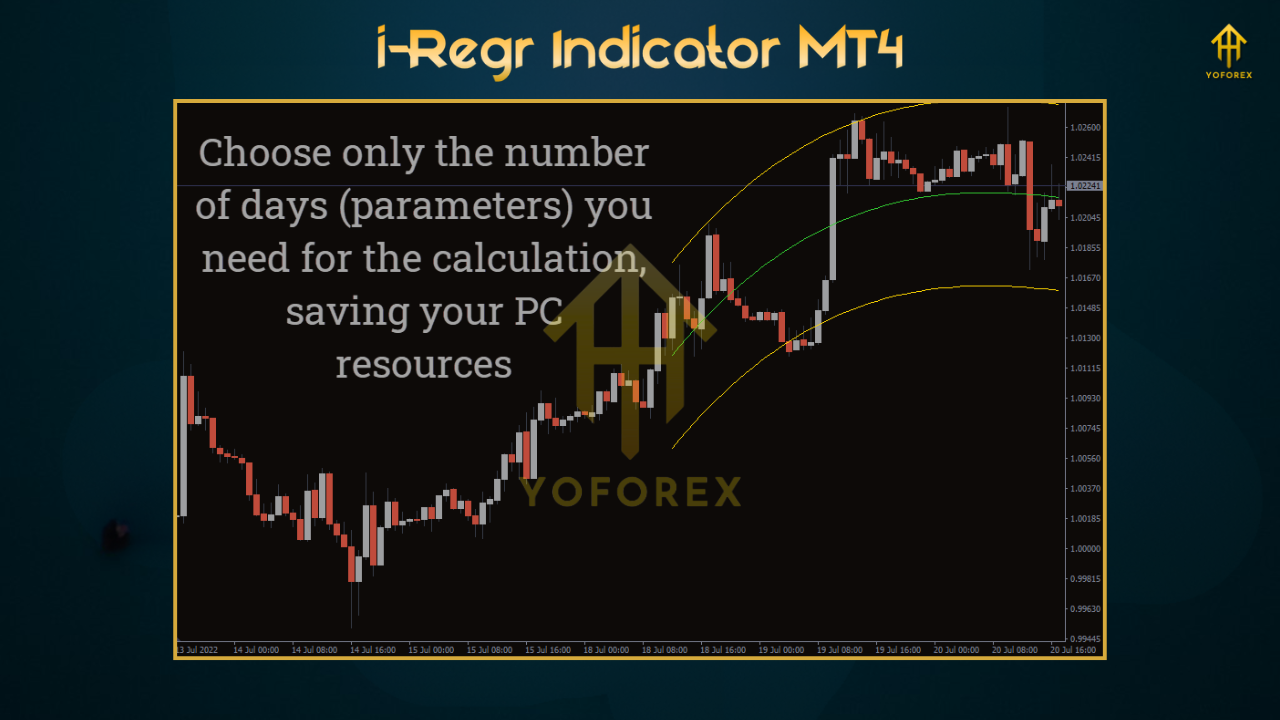
- Adaptive Length: Set the lookback (e.g., 50–200) to tune responsiveness vs. stability.
- Multisymbol Ready: Works on majors, minors, and gold; just adjust deviation multipliers per symbol volatility.
- Optional Alerts: Get notified when price touches channels, crosses midline, or slope flips.
- Clean Visualization: Minimal clutter—focus stays on price structure within the channel.
- CPU-Light: VPS-friendly; stable even on multiple charts.
How It Works (Plain English)
- Regression Line: For the last N candles, i-Regr computes a line that best fits closing prices.
- Upper/Lower Bands: It measures how far prices deviate from that line and draws symmetric bands (multiples of the standard deviation or ATR, depending on the implementation).
- Slope Reading: If the line angles up, trend is bullish; if it angles down, bearish.
Action Zones:
- Midline (mean reversion): Price tends to revisit the regression line after band touches.
- Upper/Lower Bands: Often act as dynamic S/R for pullbacks or breakouts.
Your edge comes from using slope + bands to define bias, entry timing, and risk placement—instead of eyeballing random swings.
Suggested Inputs & Presets
Scalping (M5–M15)
- Lookback (Period): 80–120
- Deviation Multiplier: 2.0–2.5
- Alerts: Band touch + slope flip
- Notes: Use London/NY liquidity; keep risk ≤0.5% per trade.
Day Trading (M15–H1)
- Lookback: 120–180
- Deviation: 2.0
- Alerts: Midline cross + band touch
- Notes: Aim for 1.5–2.5R targets; avoid trading into high-impact news.
Swing Trading (H1–H4)
- Lookback: 180–250
- Deviation: 2.0–2.5
- Alerts: Slope changes + channel break/retest
- Notes: 2–4R targets; consider partial profits at midline.
Gold (XAUUSD) Tip: Gold moves fast—widen Deviation a notch (e.g., 2.5) and set slightly larger stops. ATR-based stops pair well with regression.
Three Practical Strategies
1) Trend-Pullback Entry (Beginner-Friendly)
- Bias: Trade with the slope (long if slope up, short if down).
- Entry: Wait for price to pull back to the midline or near the opposite band and print a confirming candle (e.g., pin bar/engulfing).
- Stop: Just beyond the band or recent swing.
- Target: First target = midline (if you bought near lower band) or opposite band; second target trails behind swings.
- Why it works: You’re buying dips/selling rallies within an established trend.
2) Channel Break & Retest (Intermediate)
- Bias: Identify a strong slope and a clean channel boundary.
- Entry: On a decisive breakout beyond the band, wait for price to retest the broken band/line and hold. Enter on confirmation.
- Stop: Just beyond the retest failure level.
- Target: Measured move (recent swing size) or next HTF S/R.
- Note: Works well when volatility expands out of compression.
3) Mean-Reversion Fade (Advanced)
- Bias: Flat/weak slope (near zero) and range-like behavior.
- Entry: Fade upper band touches with bearish confirmation and lower band touches with bullish confirmation.
- Stop: Outside the band swing.
- Target: Midline or opposite band if the range is stable.
- Caution: Avoid near major news or when slope starts steepening; trend can resume suddenly.
Installation & Setup (MT4)
- Download the indicator file (
.ex4/.mq4). - In MT4, go to File → Open Data Folder.
- Navigate to MQL4 → Indicators and paste the file.
- Restart MT4 (or right-click Indicators → Refresh).
- Drag i-Regr onto your chart.
- In Inputs, configure Lookback, Deviation, Alert options, and (if available) MA/ATR smoothing.
- Click OK and save a Template so you can apply the same setup quickly to other charts.
Best Practices & Risk Tips
- Trade With Slope: Favor trades in the slope direction; fading works only in flat conditions.
- Wait for Closes: Use closed-bar signals rather than intra-bar peeks.
- Confluence Rules: Combine i-Regr with S/R, price action, and one filter (e.g., 100/200 EMA).
- Mind the News: Regression won’t protect you from slippage; step aside during red-folder events.
- Session Quality: Focus on London/NY overlap for majors; spreads are tighter and fills cleaner.
- Journal: Track setup type, slope angle, R:R, and session; tweak only one parameter per week.
- Risk Small: 0.5–1% per trade. Survival beats heroics.
Pros & Cons
- Clear, math-based trend and volatility read
- Dynamic S/R via channels for logical SL/TP
- Works across assets and timeframes
- Lightweight and beginner-friendly
- Great for both trend-following and mean reversion (with rules)
Cons
- In strong breakouts, fading bands can be risky—trade with slope
- Channels adjust with price; static “set and forget” targets may need active management
- Not a trading robot—still requires human trade management
FAQs
Does i-Regr repaint?
The regression line and bands will recalculate as new bars come in (that’s normal for rolling regression). Make decisions on closed candles and stick to rule-based entries.
What’s the best lookback?
Shorter (80–120) for responsiveness; longer (180–250) for smoother context. Start with 120–180 on M15/H1.
Is it good for prop challenges?
Yes, as a signal framework. Keep risk tight, avoid news, and trade liquid sessions.
Can I use it on crypto or indices?
If your broker offers them on MT4, yes. Increase Deviation for more volatile instruments and test first on demo.
Call to Action
If you want clean structure and a rule-based view of trend and volatility, i-Regr Indicator MT4 is a solid, no-nonsense addition to your toolkit. Start with the Trend-Pullback strategy, risk small, and collect 30–50 sample trades on demo before going live. Let your data guide any parameter tweaks—consistency over cleverness wins.
Risk Disclaimer: Trading involves risk. Past performance doesn’t guarantee future results. Always test on a demo account and never risk money you can’t afford to lose.
Happy Trading
Professional Assets
Unlock the expert tools and configurations mentioned in this article.
Get Files NowSecure Gateway • Verified by YoPips
Sayan
Financial analyst and professional trader dedicated to cracking the code of forex markets. Join our community for daily insights and expert tool reviews.
Never miss a market crack.
Join 15,000+ traders receiving our weekly breakdown of elite tools and strategies.
No spam. Just high-impact trading insights.